At some point during development, I ran docker ps and counted 16 containers. Then there were the systemd services — PostgreSQL, SSH, the core server itself. Plus internal workers: the job scheduler, the async queue, the WebSocket server, the OpenClaw gateway. And Ollama, sitting quietly with a 4B model eating 5.4GB of VRAM.
40 processes. On a machine with 8GB of RAM.
Not all of them need to run simultaneously. The mail server needs to be always on. The PDF converter only needs to run when someone opens a document. Jellyfin only needs to run in the evenings. The voice STT model can sleep unless someone is talking.
This post is about the process manager that orchestrates all of that — a unified view of everything running on the system, a RAM budget engine that decides what fits, and lifecycle policies that start and stop services based on actual usage.
The unified view
The first problem was visibility. Docker containers report stats through the Docker API. Systemd services report through systemctl. Internal Node.js workers (scheduler, queue, WebSocket) only exist in the Claw Core process. Ollama has its own API for model management. Four different systems, four different interfaces.
We unified them into a single table with a consistent model:
interface ClawProcess {
  id: string;           // 'docker:claw-whisper', 'systemd:postgresql', 'internal:scheduler'
  name: string;         // 'Speech-to-Text (Whisper)', 'PostgreSQL', 'Job Scheduler'
  type: 'docker' | 'systemd' | 'internal';
  status: 'running' | 'stopped' | 'failed' | 'starting';
  cpu_percent: number | null;
  memory_bytes: number | null;
  gpu_percent: number | null;
  vram_bytes: number | null;
  uptime_seconds: number | null;
  restartable: boolean;
  stoppable: boolean;
  has_logs: boolean;
}
The id format type:name makes every process globally addressable. docker:claw-mailu-imap is the IMAP container. systemd:postgresql is the database. internal:async-queue is the background job processor. One namespace, one table, one API.
Three collectors feed the table:
| Collector | Source | Method |
|---|---|---|
| Docker | Docker Engine API | GET /containers/json via Unix socket |
| systemd | systemctl | list-units --type=service --output=json |
| Internal | Claw Core process | In-memory state from scheduler, queue, WS server |
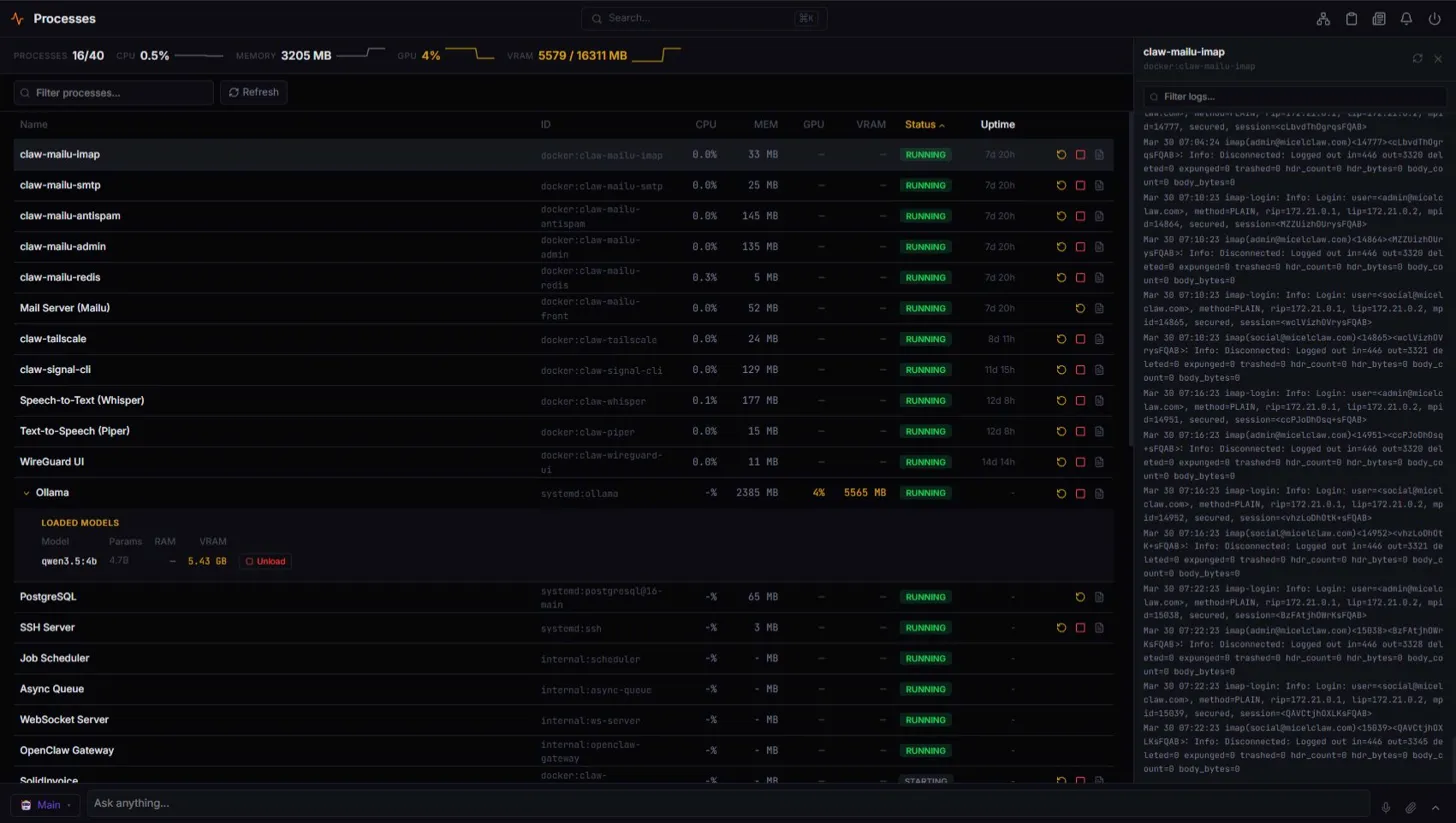
Plus a special case: Ollama. It’s a systemd service, but it also has loaded models that consume VRAM independently. The process manager queries Ollama’s API (GET /api/ps) to show which models are loaded, their parameter count, and VRAM usage. You can unload a model directly from the process table to free VRAM.
The summary bar
The top of the process manager shows system-wide stats at a glance:
PROCESSES 16/40 CPU 0.5% MEMORY 3205 MB GPU 4% VRAM 5579 / 16311 MB16 out of 40 registered processes are currently running. Total CPU across all processes. Total memory. GPU utilization and VRAM usage (critical when you’re running AI models locally).
The VRAM indicator is particularly useful. When Ollama loads qwen3.5:4b, it consumes 5.4GB of VRAM. If someone tries to load a second model and there isn’t enough VRAM, the process manager shows exactly why. No more mysterious “out of memory” errors — the dashboard tells you what’s using what.
Lifecycle policies: not everything needs to be always-on
The real power isn’t the table view — it’s deciding what runs and when. Each managed service has a lifecycle policy:
| Policy | When it runs | Example services |
|---|---|---|
| Always-on | 24/7, never auto-stopped | PostgreSQL, Claw Core, mail server, WireGuard, Tailscale |
| On-demand | Starts when the user navigates to the module, stops after idle timeout | ONLYOFFICE, Stirling PDF, Portainer, SolidInvoice |
| Scheduled | Runs during configured time windows or intervals | Jellyfin (08:00-01:00), RSS fetcher (every 60 min) |
| Triggered | Starts on a specific event, stops when the task completes | yt-dlp (download requested), claw-vision (photo uploaded) |
In a real deployment, the breakdown looks like this: 5 always-on services, 22 on-demand, 8 scheduled. The 22 on-demand services are the key — they represent ~70% of total potential memory usage, but most of the time only 2-3 of them are actually running.
When you open the Office module in the dashboard, the system starts ONLYOFFICE (if it’s not already running). The loading state shows a progress spinner. After 30 minutes of no document activity, ONLYOFFICE stops automatically. You never think about it.
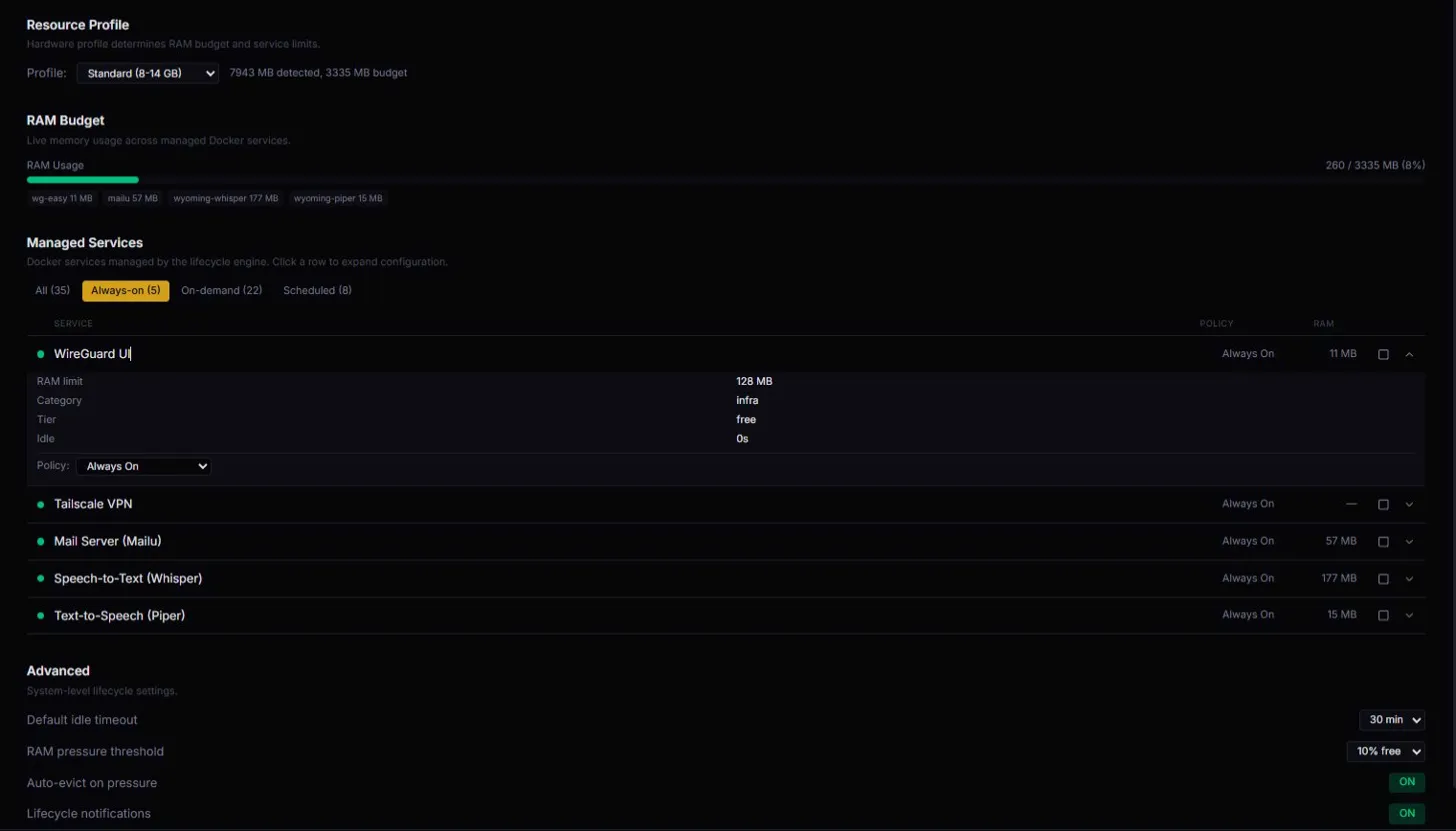
Each service’s policy is configurable in Settings → Services. Click on a service to expand its configuration: policy selector (always/scheduled/on-demand/disabled), schedule windows, timeout settings, RAM limits. Presets cover common patterns (“Diurnal” for services that run during working hours, “Periodic fetch” for services that sync on intervals).
The RAM budget engine
Here’s the core problem: 40 services can’t all run on 8GB of RAM. Something has to decide.
The RAM budget engine works with hardware profiles:
| Profile | RAM | Budget for services | Max concurrent on-demand |
|---|---|---|---|
| Lite | ≤ 6 GB | ~1.5 GB | 2 |
| Standard | 8-14 GB | ~3.3 GB | 4 |
| Performance | 16+ GB | ~8 GB | 8 |
The profile is auto-detected from system RAM and determines the budget — how much memory is available for managed Docker services (excluding always-on core services like PostgreSQL and Claw Core, which are non-negotiable).
Before starting any on-demand service, the engine checks:
Can this service fit in the remaining budget?
├── Yes → Start it
└── No → Is there an idle on-demand service we can evict?
    ├── Yes → Stop the longest-idle service, then start the new one
    └── No → Tell the user: "Not enough memory. Stop X to start Y."
Eviction targets the longest-idle on-demand service. Always-on services are never evicted — the system won’t kill your mail server to make room for a PDF converter. The user always has the final say: the engine suggests what to evict, but it doesn’t force it.
Under memory pressure (free RAM drops below 10%), the engine gets more aggressive: it progressively stops idle on-demand services until pressure is relieved, notifying the user via WebSocket for each one.
The RAM budget view in Settings shows this live:
RAM Budget: 260 / 3335 MB (8%)
├── wg-easy: 11 MB
├── mailu: 57 MB
├── wyoming-whisper: 177 MB
└── wyoming-piper: 15 MB
260MB used out of a 3,335MB budget. Room for several more on-demand services before the budget gets tight.
Drain guards: stopping safely
You can’t just docker stop a service and hope for the best. ONLYOFFICE might have a document open. Qbittorrent might be mid-download. The terminal might have an active SSH session.
Drain guards check safety before stopping:
| Service | Guard | What it checks |
|---|---|---|
| ONLYOFFICE | Document sessions | Are there open documents? → Auto-save first |
| Qbittorrent | Active downloads | Is anything downloading? → Wait or warn |
| Terminal | SSH sessions | Are there active sessions? → Warn user |
| Jellyfin | Active streams | Is anyone watching? → Warn user |
If a drain guard blocks a stop operation, the user gets a notification: “ONLYOFFICE has 2 documents open. Save and close them, or force stop.” Force stop is always available — but the system tries to prevent data loss by default.
Ollama: the special case
Ollama deserves its own section because it’s neither a simple Docker container nor a systemd service — it’s both. The systemd service runs the Ollama daemon. The models loaded into it consume VRAM independently of the daemon’s RAM usage.
The process manager handles Ollama differently:
- Shows the Ollama daemon as a systemd process with its own CPU/RAM stats
- Below it, shows loaded models in an expandable section: model name, parameter count, RAM usage, VRAM usage
- Each model has an “Unload” button that calls
DELETE /api/generateto free VRAM - The summary bar includes VRAM as a separate metric from RAM
In our current setup, qwen3.5:4b sits loaded with 5.43GB of VRAM. When we need to load a different model (say, for a vision task), the process manager shows the VRAM impact before loading. If VRAM is full, you can unload the current model first.
The Ollama client in Claw Core (the priority queue singleton from post 2) manages model loading automatically — it loads models on demand and unloads them based on idle time. The process manager gives you visibility into what it’s doing and manual override when you need it.
The log panel
Every process with has_logs: true gets a log viewer. Click the logs icon on any process row and a side panel opens with the last 200 lines, auto-scrolling, with a filter input for grep-style searching.
Docker logs come from the Docker API (GET /containers/{id}/logs). Systemd logs come from journalctl -u {service}. Internal workers log to pino (the Fastify logger) and their output is captured from the running process.
The filter is surprisingly useful for debugging. When Mailu’s IMAP container is acting up, filtering for “error” or “failed” in the log panel is faster than SSH-ing into the server and running docker logs | grep.
Approval integration
Process lifecycle operations integrate with the approval system (post 11):
| Operation | Approval level |
|---|---|
| View processes, logs | Level 0 (auto) |
| Start a service | Level 0 (auto) |
| Restart a service | Level 2 (confirm) |
| Stop a service | Level 2 (confirm) |
Starting is unrestricted because the RAM budget engine already gates it — if there’s no budget, it won’t start. Restart and stop require confirmation because they affect running services. The agent can restart a crashed container, but only after asking “claw-mailu-imap is failing, should I restart it?”
What the numbers look like in practice
On our development machine (8GB RAM, RTX 2060):
| Category | Count | Typical RAM |
|---|---|---|
| Always-on (core) | 5 | ~400 MB |
| Always-on (mail) | 6 | ~400 MB |
| Always-on (network) | 3 | ~50 MB |
| Always-on (AI) | 3 | ~200 MB |
| On-demand (active) | 2-3 | ~300-500 MB |
| Systemd | 3 | ~100 MB |
| Internal workers | 5 | ~50 MB |
Total running at any given time: ~15-20 processes, ~1.5-2 GB. Well within the Standard profile’s 3.3GB budget. The other 20+ on-demand services wait in Docker’s stopped state, consuming zero RAM.
Peak usage (everything on-demand activated simultaneously): ~4.5 GB. This never actually happens — it would require opening every module in the dashboard at the same time. The lifecycle policies ensure only what’s needed is running.
What I’d do differently
I’d build the RAM budget engine before adding any managed services. We added services first (mail, PDF, office, media) and the budget engine later. During the gap, the machine would occasionally OOM because too many containers were running. The budget engine should have been the foundation, not an afterthought.
I’d add a “service groups” concept. Right now, Mailu is 6 separate containers (IMAP, SMTP, antispam, admin, Redis, frontend). They start and stop together, but the process table shows them individually. A group like “Mail Server” that expands to show its 6 components would reduce visual noise from 40 rows to ~20.
I’d expose the process table via the agent. Currently, the agent can restart and stop services via the HAL API, but it can’t see the process table the way the dashboard shows it. A claw-processes skill with ?format=compact would let the agent answer “what’s using all my RAM?” with actual data instead of guessing.
The takeaway
A self-hosted personal OS isn’t one service — it’s 40 services pretending to be one. The user should never think about which containers are running, how much RAM they’re using, or when to start and stop them. That’s the process manager’s job.
Three components make it work: a unified process table (Docker + systemd + internal + Ollama, one namespace), a RAM budget engine (hardware profiles, eviction logic, pressure detection), and lifecycle policies (always-on, on-demand, scheduled, triggered).
The result: 40 services on 8GB of RAM, with the user seeing a single coherent system. The process manager is the plumbing that makes “personal OS” feel like an OS instead of a collection of Docker containers.
Next up: InsightFace face recognition on a mini-PC — how we built a face detection pipeline that clusters people across your photo library using a 2B model and a Python sidecar, all running on CPU.